

Background
With a diverse range of staff and stakeholders spanning different business groups, operational disciplines and locations, each with their own area of expertise and level of technical maturity, it has traditionally been difficult to get the right information to the right person. Additionally, providing an intuitive interface all users can use to refine and analyse this information to gain insights into the data has been challenging.
Conventional approaches using Business Intelligence (BI) tools are too heavily reliant on data scientists who try to create dashboard views and reports based on what they think end users want to see.
In many cases, the users themselves have a limited understanding of the links and relationships within/across different data sets and are not well equipped to communicate requirements to the expert data scientists. Traditional BI tools are typically too complex for non-specialist users, meaning the majority of people cannot self-serve and create the dashboards and reports they need to get data insights into the critical areas most relevant to their role and areas of expertise.
Elafent Cloud Platform (ECP) takes the complexity out of data reporting and analysis by dynamically aggregating and correlating heterogeneous data sets from different systems and providing rich visualisations that everyone can use to gain insight into the data which is most important to them.
Operational Challenges
Gaining insight into different operational datasets is a challenging prospect and often an unachievable exercise for non-expert users. In many cases, staff -
Rely exclusively on subject matter experts (SMEs) to perform data queries and generate reports and dashboards using specialist tools
Burn cycles defining requirements for what they think they need to know, so SMEs can prepare the necessary data outputs for them
Receive information that is too broad and not relevant to their specific needs and requirements
Cannot effectively navigate and refine data to create and save their own specialist data views based on what’s important to them or share this view with other stakeholders in their team
Are unaware of the potential links and relationships between different data sets and simply don't know the right questions to ask SME's and in turn, miss out on valuable insight
Struggle to access analytics and reporting information in the field from their mobile device.
Customers and community members are often in the same boat, struggling to understand the relationships between datasets which could impact them, the wider community, their business or their family and friends and revert to contacting the call centre when they can't get the information they need.
Many specialist BI tools -
Are too complex for non-specialist users, customers and community members to access
Are too expensive to roll out to a larger user base across the greater organisation or to make available to customers and/or the community
Require a lot of heavy lifting to take advantage of external related data sets from peer organisation or external service providers
Do not update in real time to reflect changes in the underlying data
Have not been designed from the ground up to work on mobile devices and as such, can be difficult for users to access in the field.
These limitations can lead to -
Valuable operational insight getting lost and not taken advantage of
Critical decisions being made on incomplete or out of date information
Increased load on call centre staff
SMEs being inundated by information requests
Reduced efficiency and resolution times
Increased operational costs
Frustrated workers and customers.
Operational Optimisation
The Elafent Cloud Platform (ECP) takes the complexity out of data reporting and analysis by aggregating and correlating heterogeneous data sets from different systems and providing rich dynamic visualisations that everyone can use to gain insight into the data which is important to them.
Key elements of this capability include -
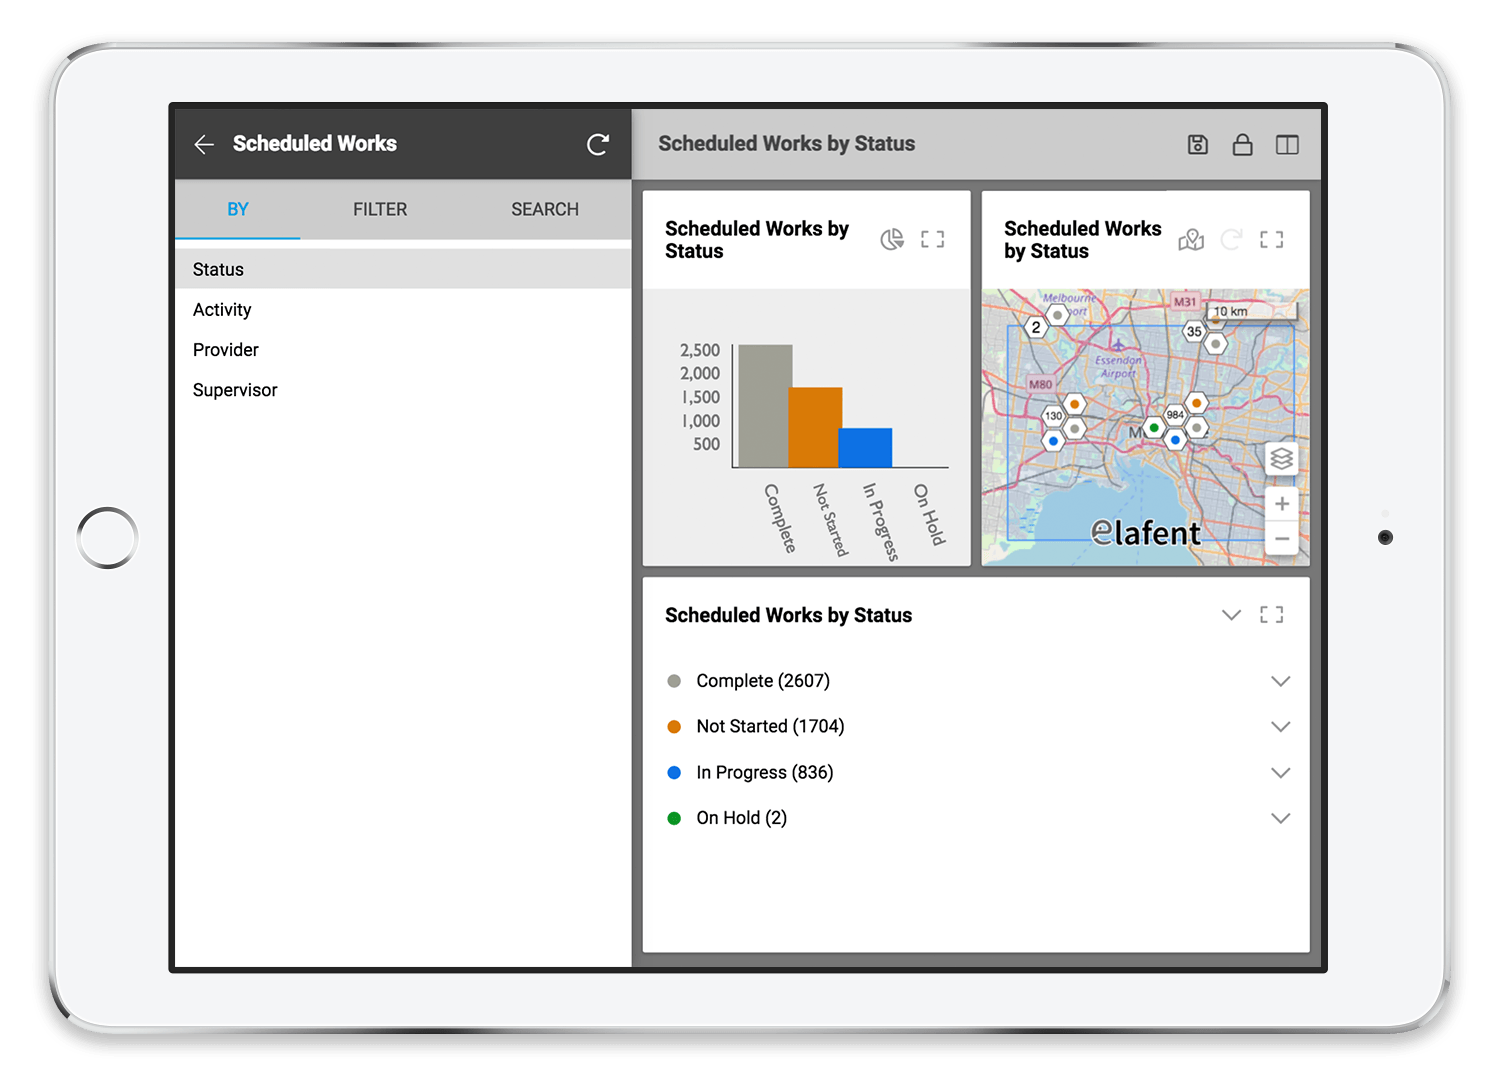
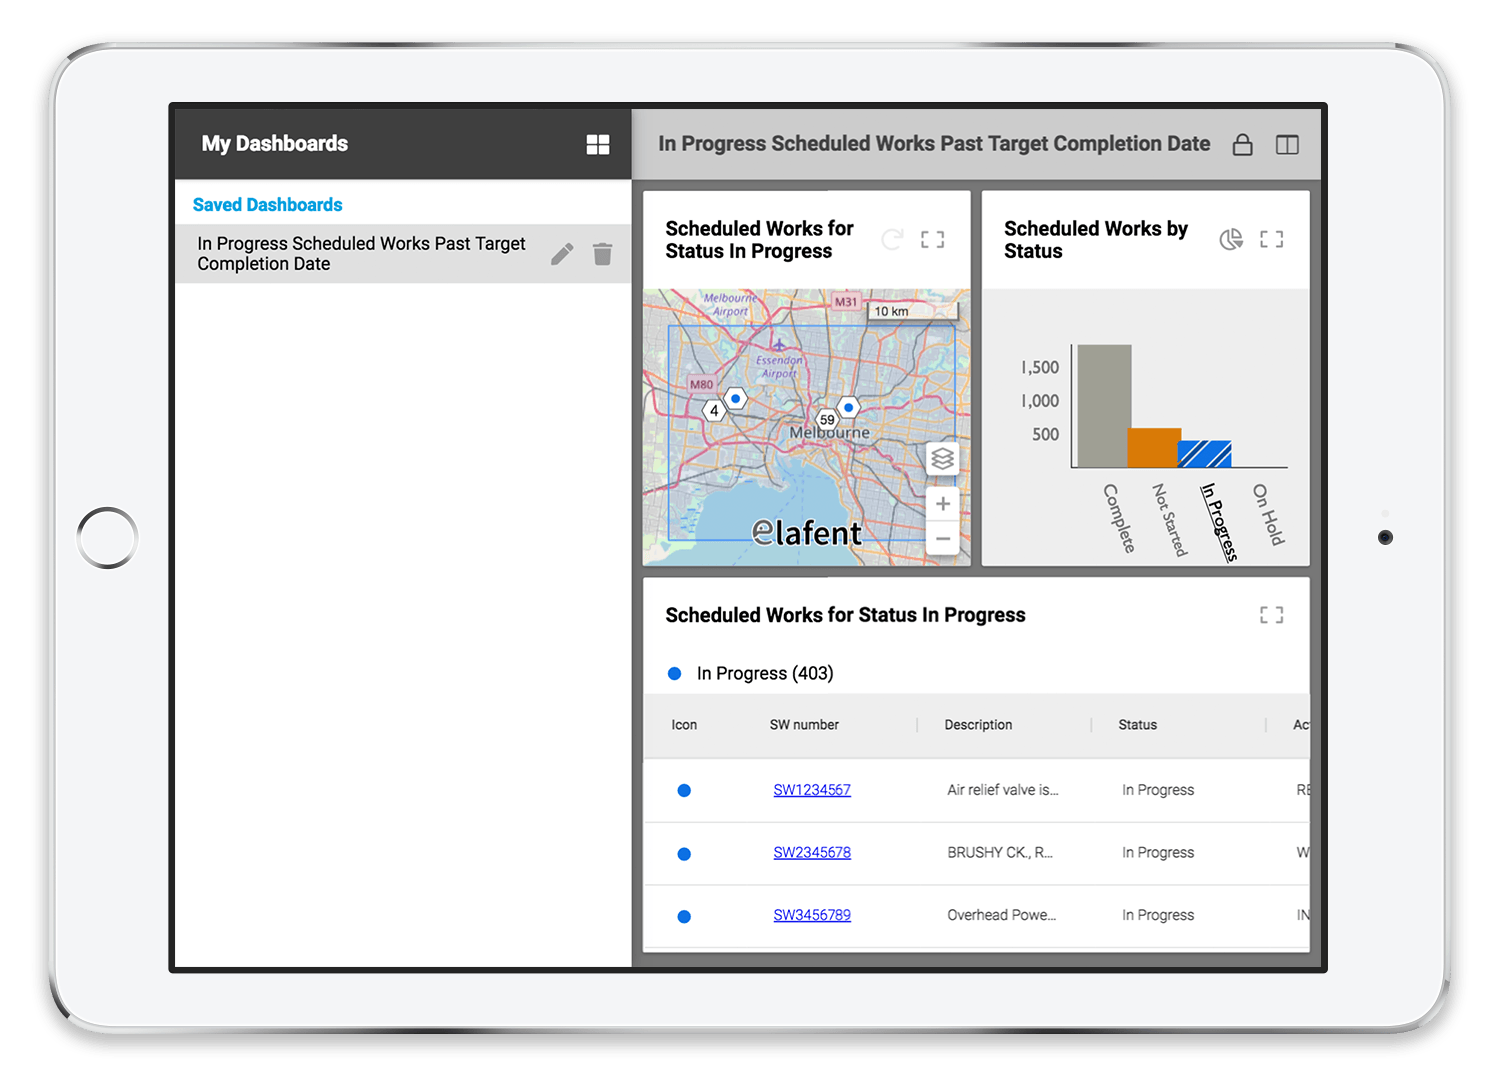
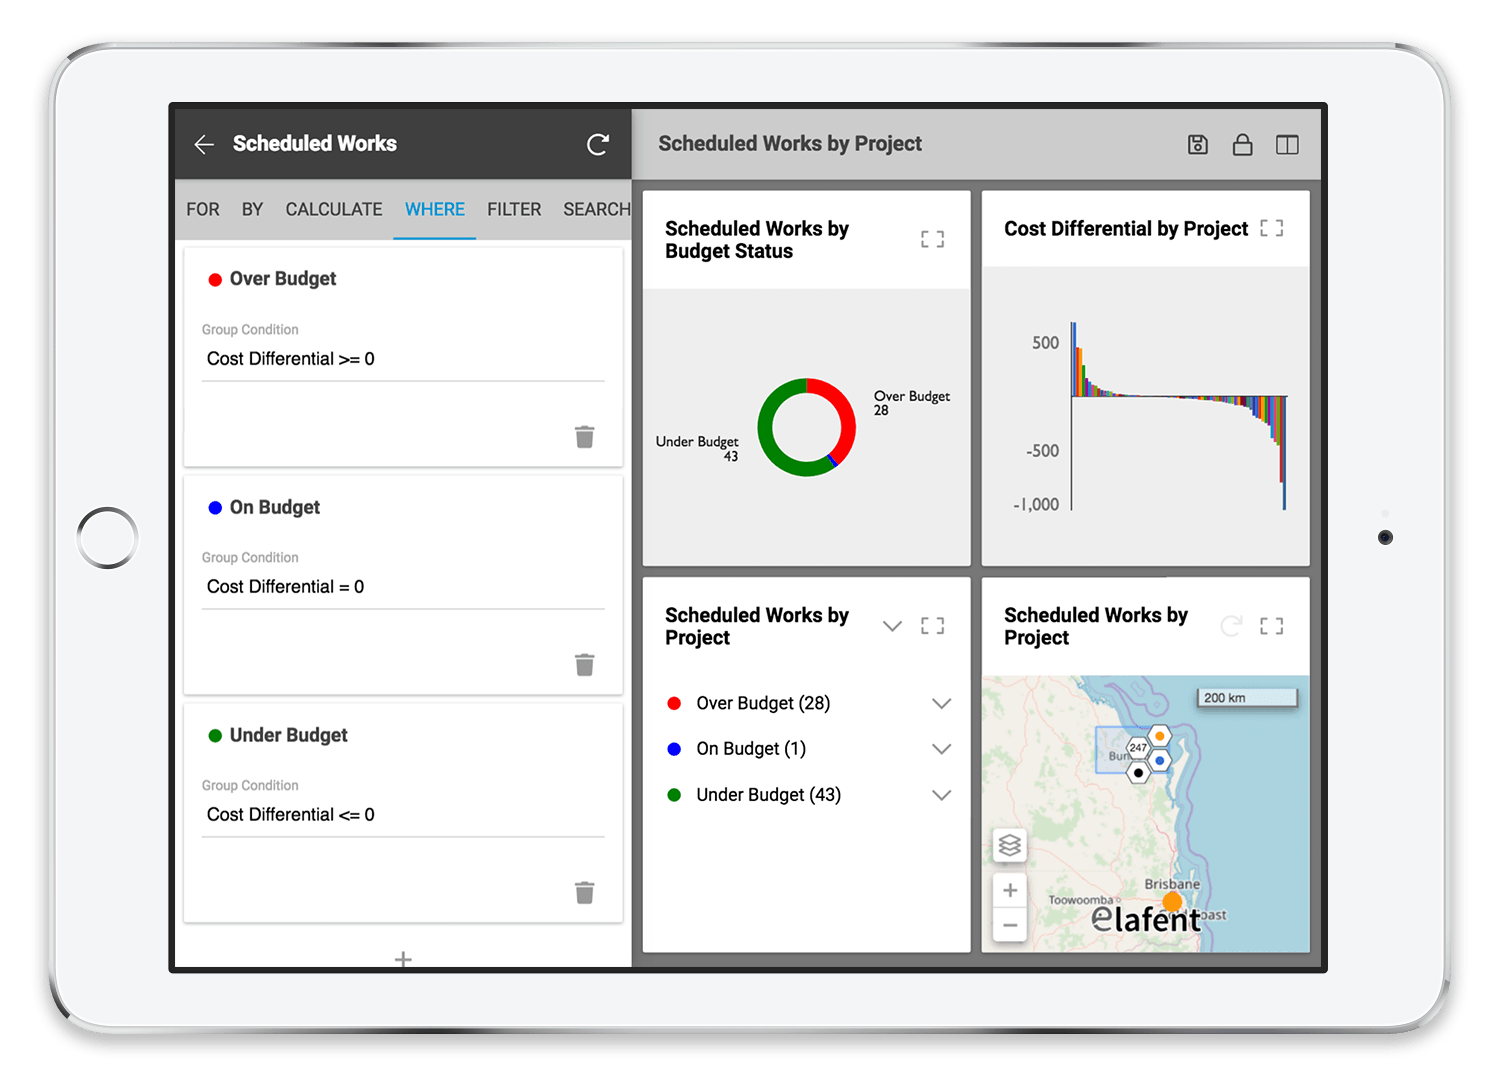
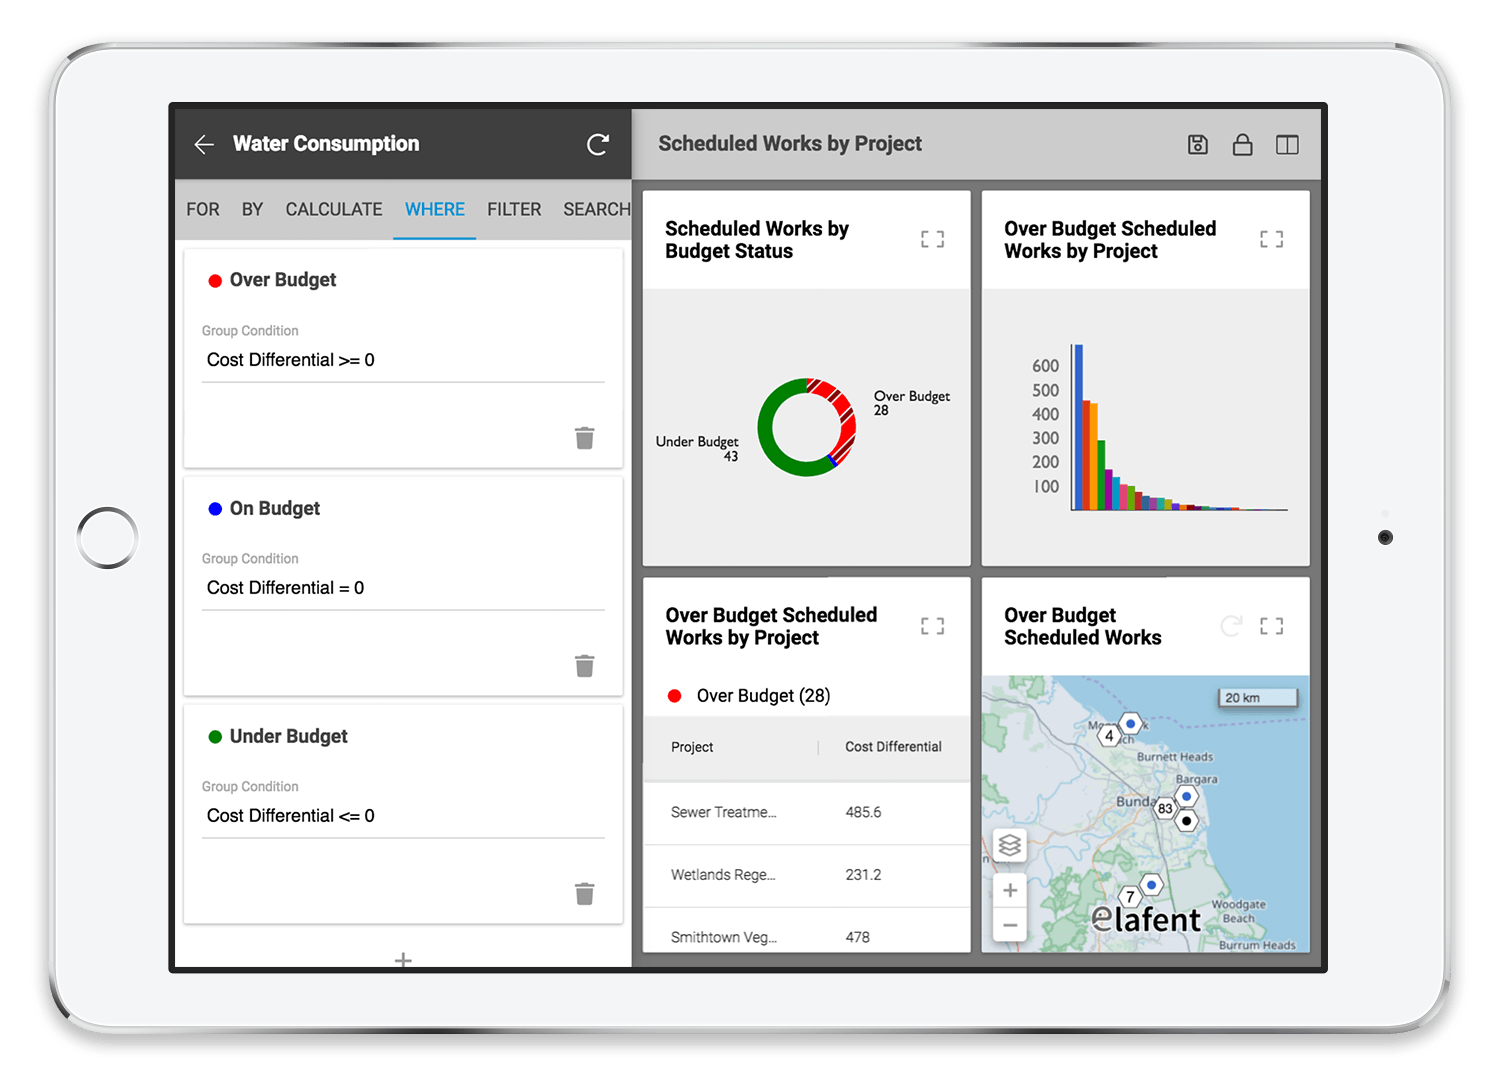
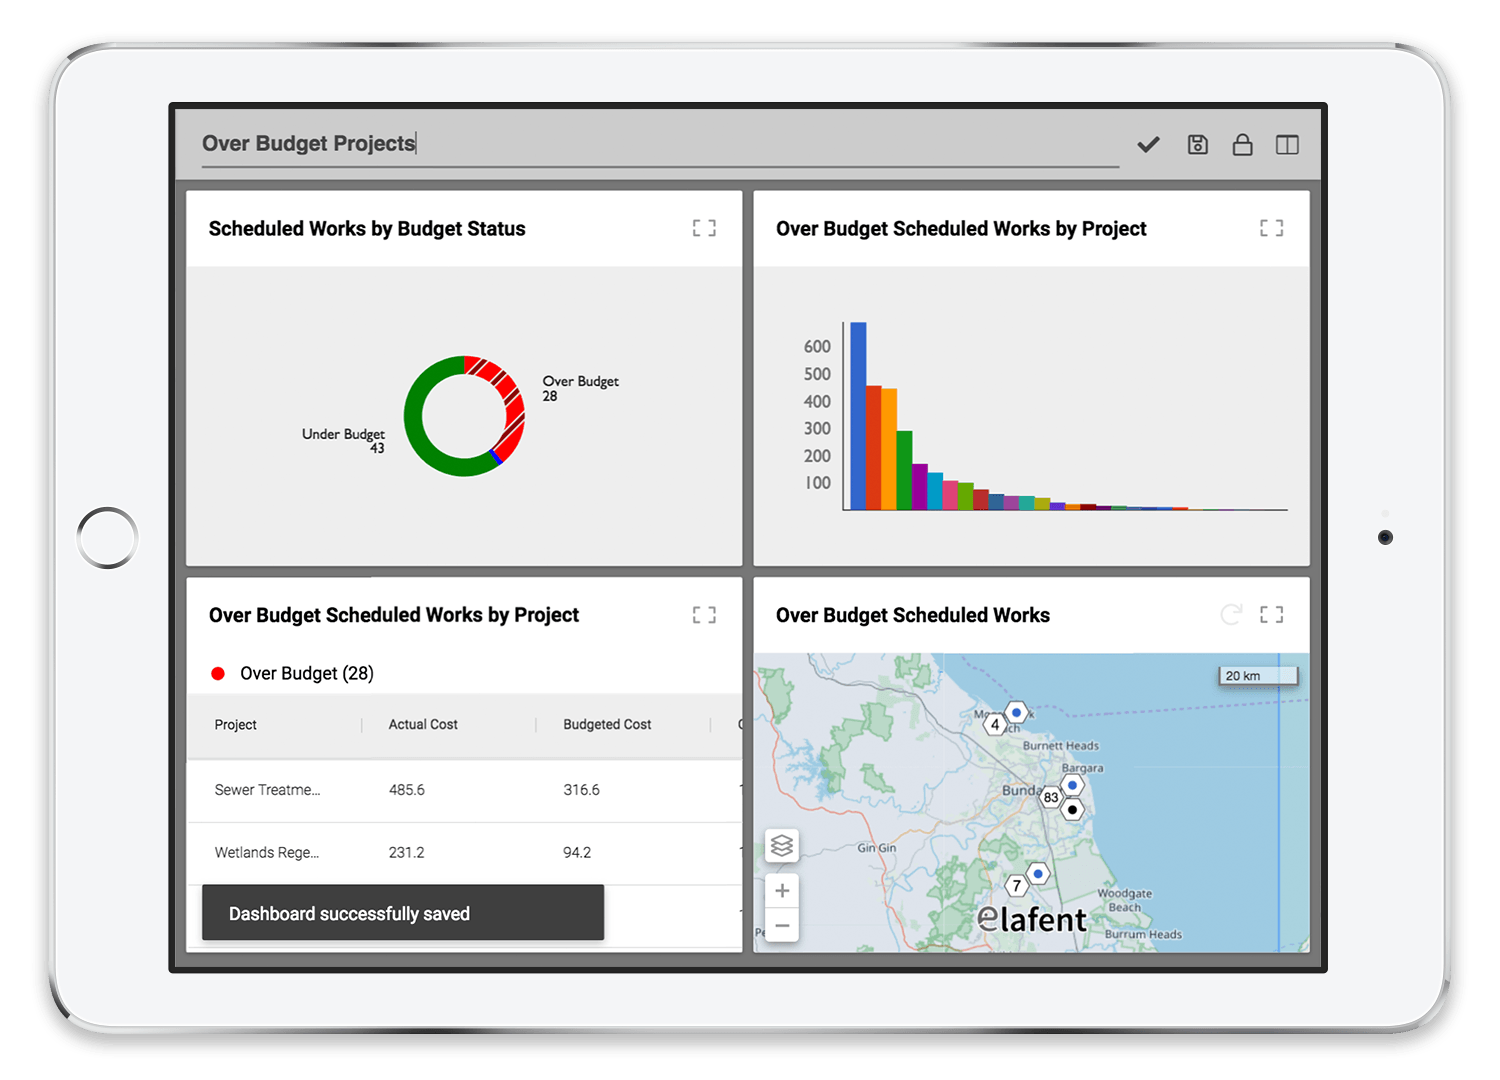
Simple to use, intuitive user experience enabling non-specialist and specialist users alike to gain valuable insight into the relationships within data through the following dynamic dashboard widgets -
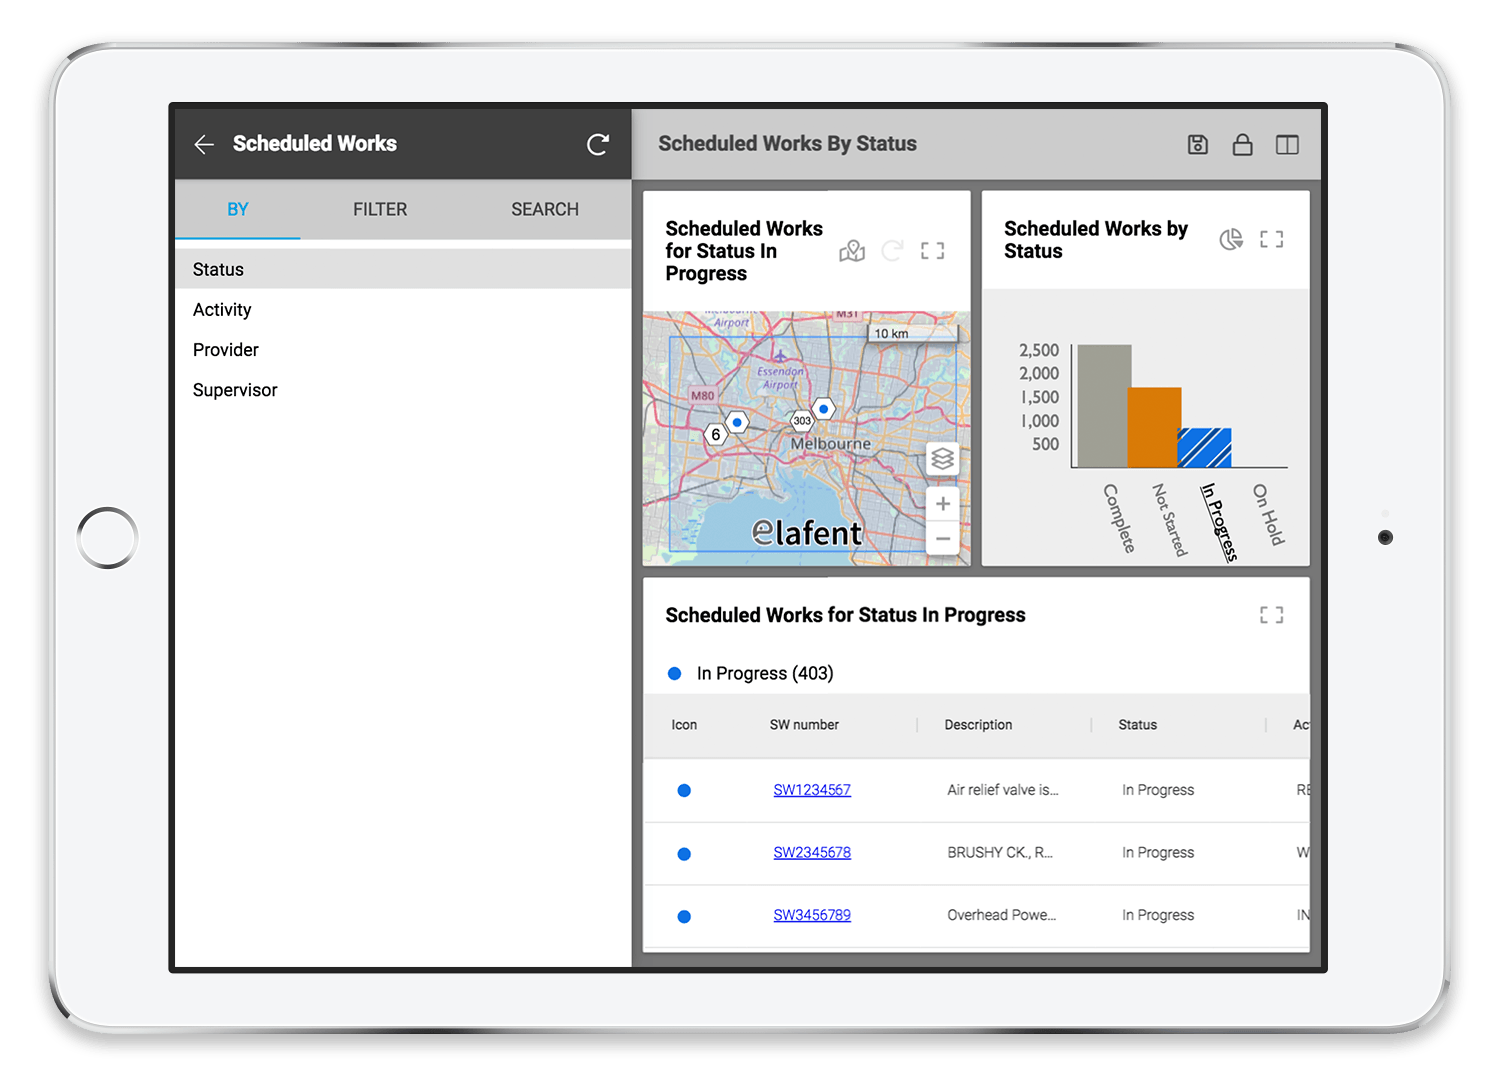
Spatial - Displaying a variety of data (point, line and polygon) on a map and providing advanced spatial visualisations of data such as rate, hotspot and flow maps
Table - Enabling a variety of data to be viewed, grouped, sorted and refined in a dynamic table to provide a different perspective
Chart - providing rich visualisations of data via pie and column charts to uncover greater operational insights
Ability to display multiple widgets in a single screen, so users can access a variety of data visualisations in the same place
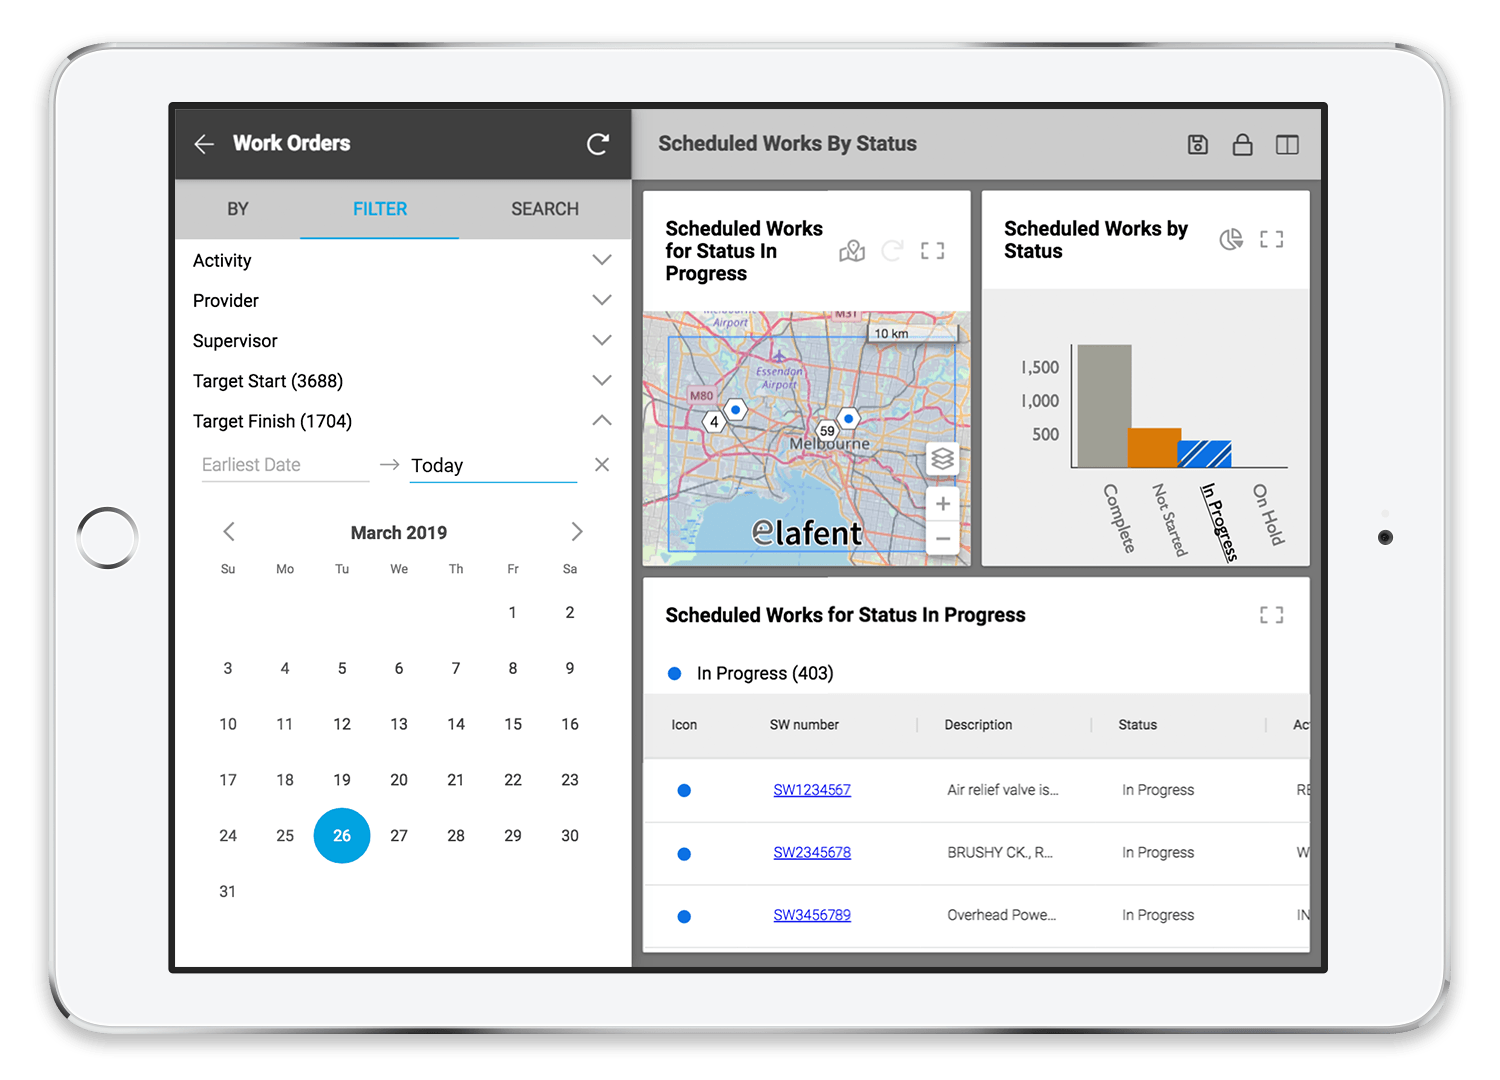
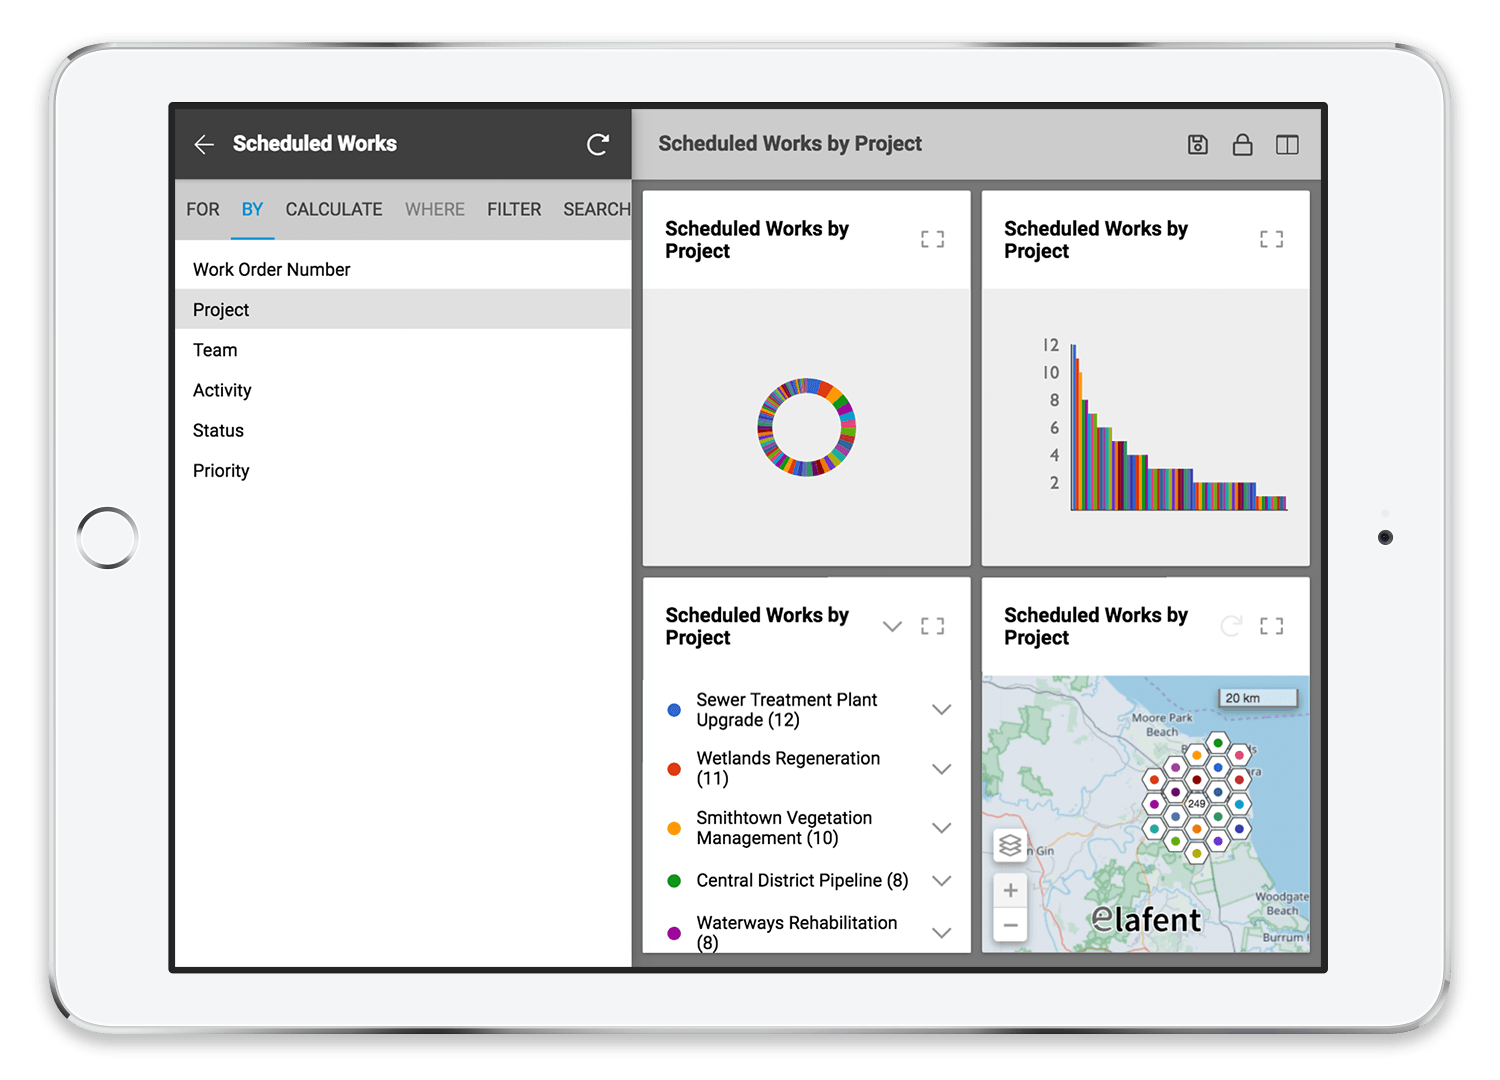
Configurable widgets enabling users to refine, customise and optimise each dashboard view by -
Moving and resizing the dashboard widgets
Selecting different data attributes to group the data by
Filtering the data by selecting/deselecting a variety of data attributes
Applying search-based filters based on specific key terms
Linked widgets enabling users to interact with an individual dashboard widget and in-turn update other linked dashboard widgets to refine the overall view of data
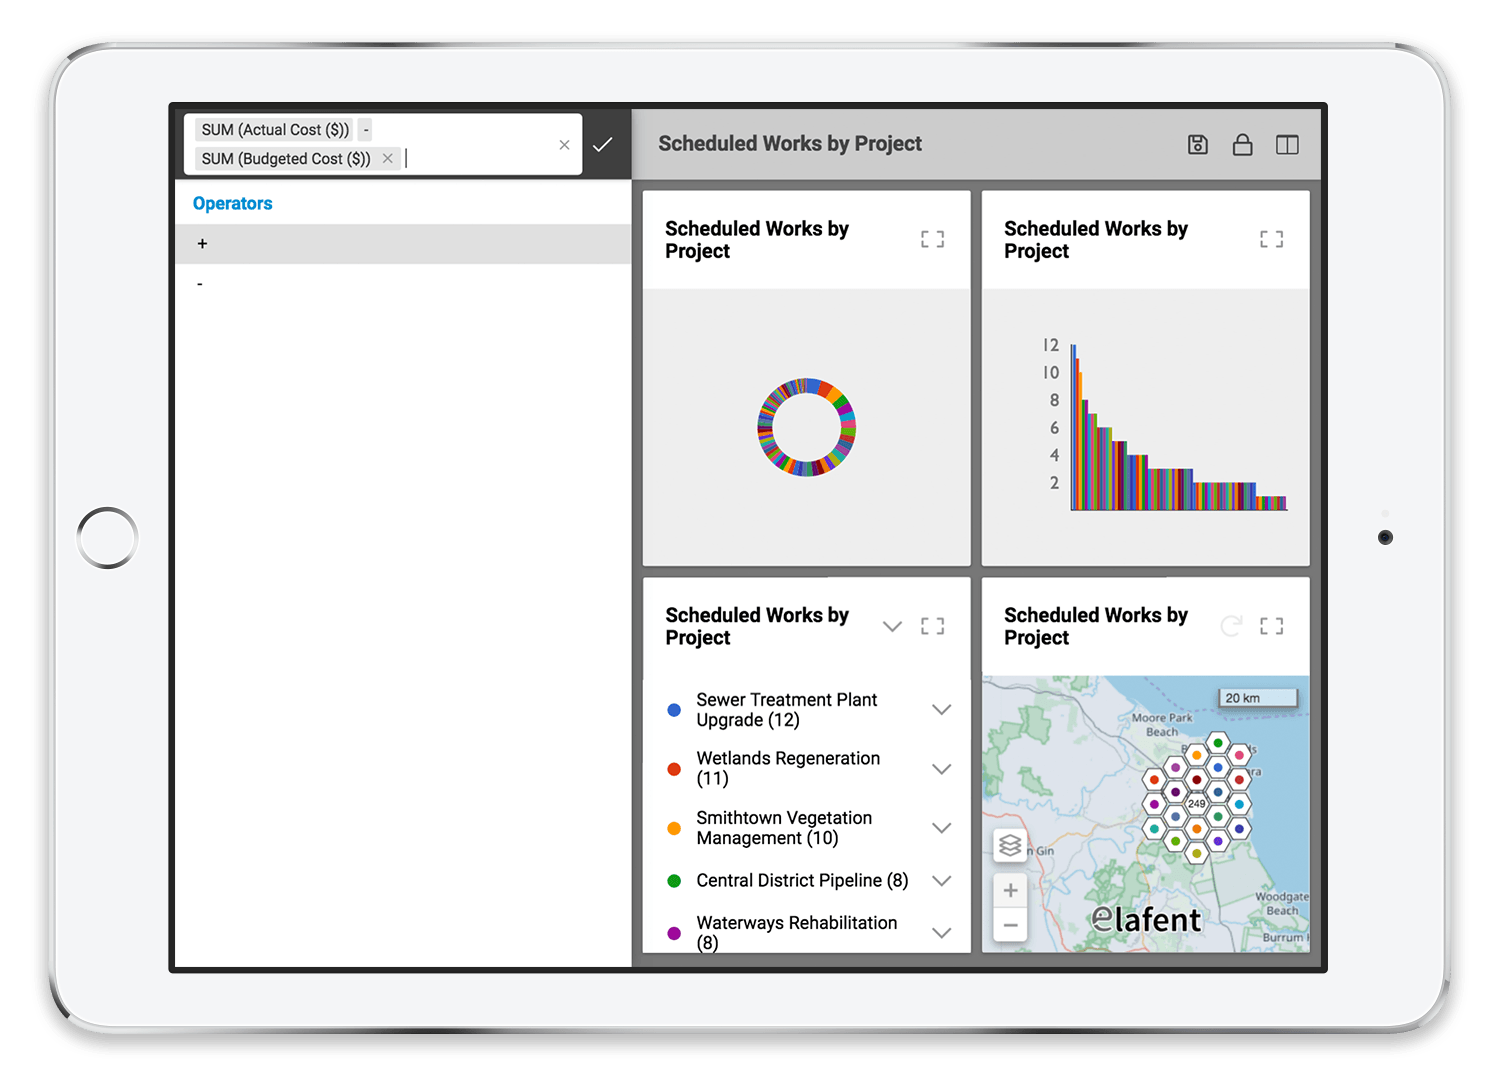
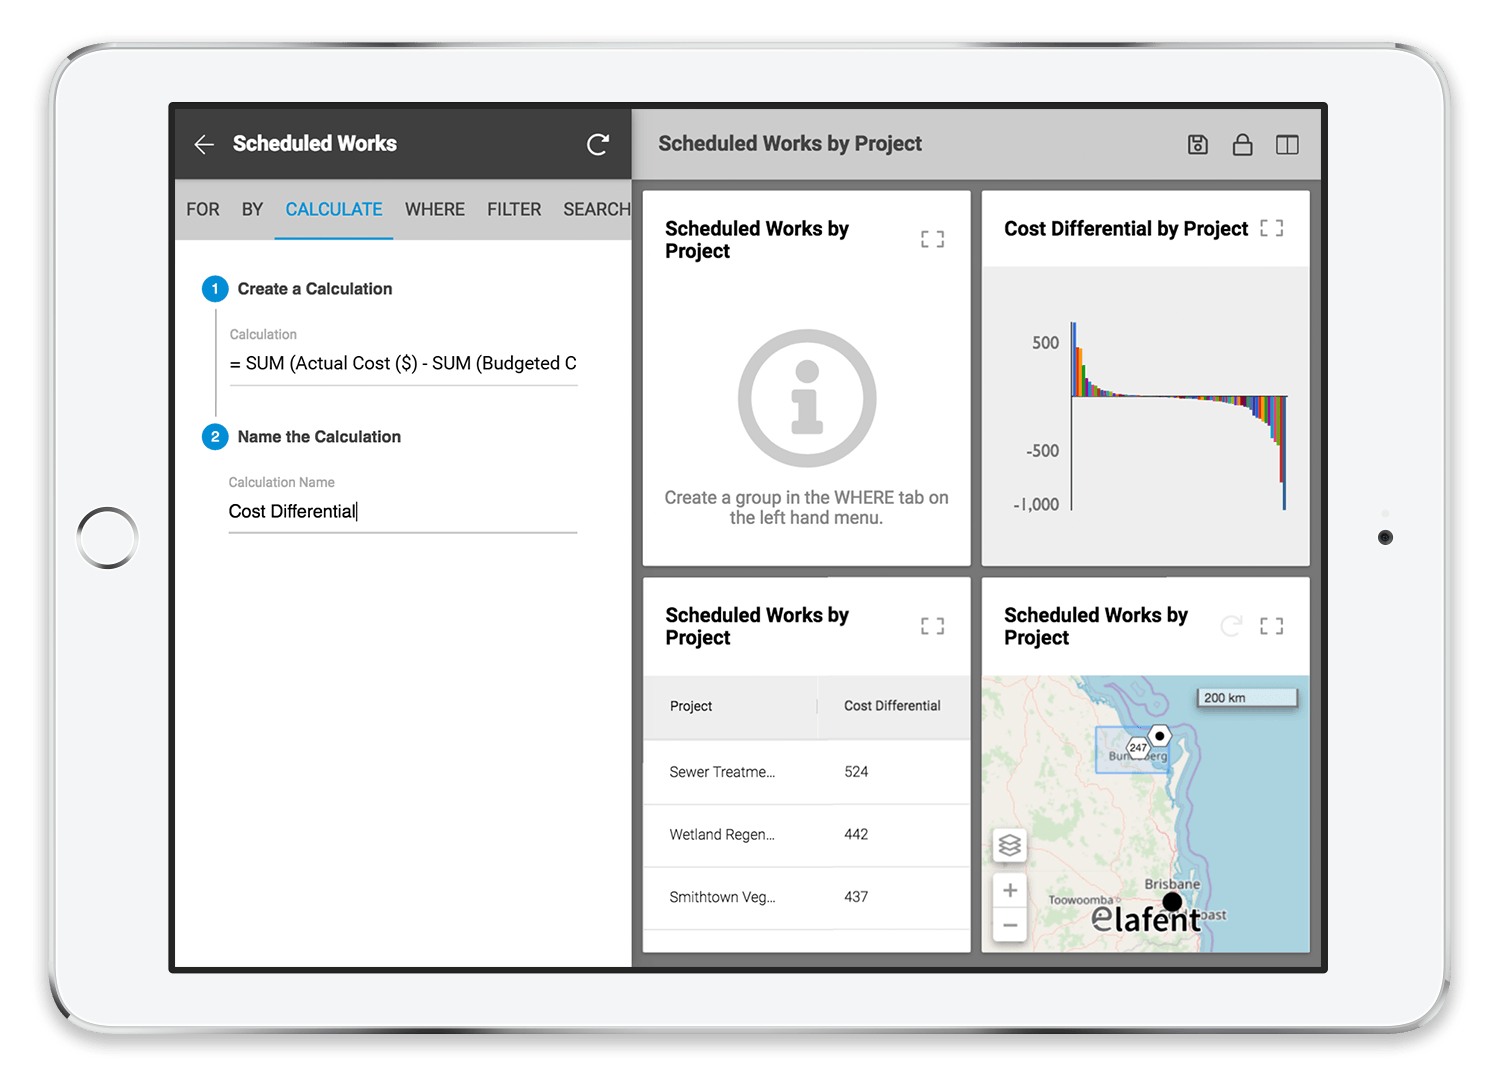
Advanced calculation-based dashboards enabling users to apply their own unique calculations to multiple data attributes to create powerful reports and views of data
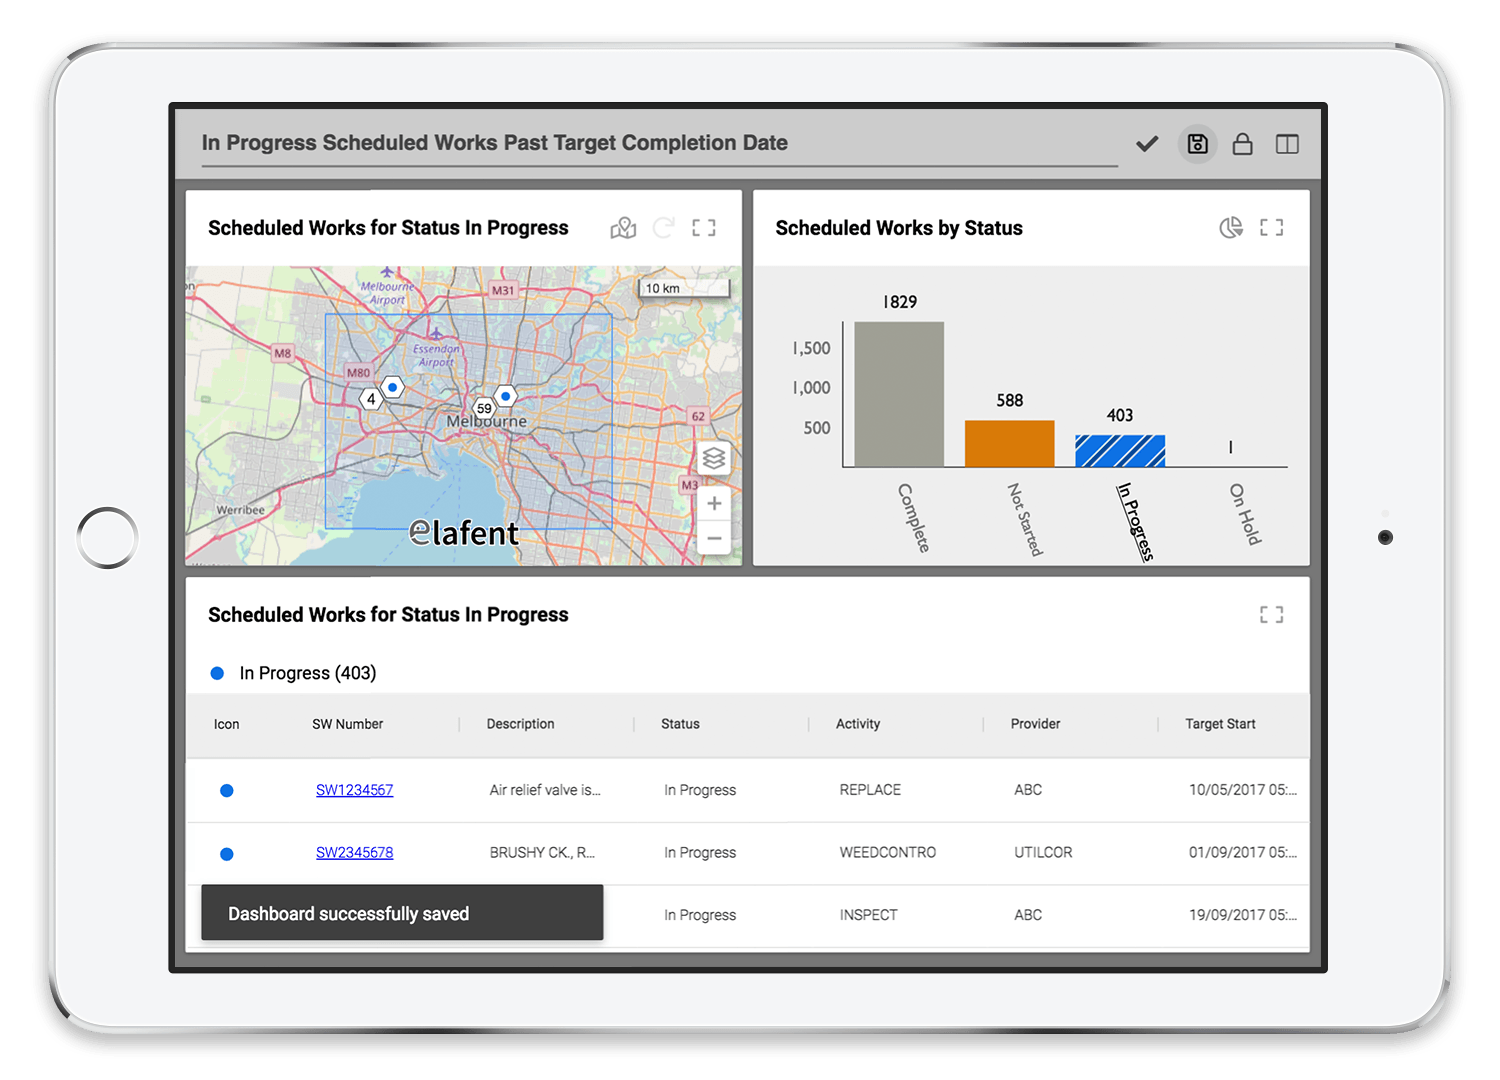
Savable Dashboards enabling users to configure and share optimised visualisations of data to support unique operational processes, business groups and individual requirements
Dynamic data support ensuring dashboard views are updated automatically to reflect any changes in the underlying data, so users always get correct and up to date information
Spatial Correlation and Analysis driven dashboards enabling users to create dynamic dashboard views on the fly based on the analysis and correlation of existing spatial data (point, polygons, lines) or user defined spatial data (point, polygons, lines)
Default user view preferences enabling individual users or administrators to configure the view of data accessed by default in the Elafent app, so users are taken to the most relevant view of information as soon as they sign in.
iOS and Android Support enabling data investigation and analysis to be performed in the field via a heterogeneous mix of devices as required by staff, contractors and peer organisations.
Business Impact
The Elafent Cloud Platform (ECP) breaks down the technical, usability and budgetary barriers associated with data reporting and analysis, so everyone can gain valuable insights into the data which is most important to them. Benefits include -
Greater levels of operational insight
Improved quality of operational decision making
Reduced load on subject matter experts/specialist users
Increased efficiency
Reduced costs
Less frustrated workers, customers and community members.